NextDC (ASX:NXT) FY24 Result review
Is the Risk-Reward Balance Justified?
Disclaimer: The information contained within this website and article is not financial advice and reflects my opinion in a strictly personal capacity. I am an engineer by training and profession; I do not possess formal qualifications in finance or investment. I may hold positions in the stocks mentioned and hence probably biased. This website and article aren’t written to give you advice. I am just using it as my online journal to share knowledge and insights and to get feedback - I can’t guarantee the complete accuracy of all content so don’t rely on it. Please conduct your own research or consult a professional financial advisor - I am not the one.
On Tursday, August 29th, 2024, Data Center company NextDC (ASX:NXT) reported its FY 2024 results. Let’s take a closer look at the result and what they mean for the company’s future growth
Key Highlights from FY24:
Total Revenue grew by 11%, reaching $404 million.
Net Revenue increased by 10% to $307.9 million.
EBITDA increased by 4% to $190.7 million.
Underlying EBITDA increased by 5% to $204.2 million.
Loss after Tax around $44 million
They ended the year with $1.24 billion in cash and $1.37 billion debt on the balance sheet.
Financial Performance
Total Revenue vs Net Revenue
Until FY24, NextDC reported its performance using total revenue. However, from this year onwards, it has shifted to reporting net revenue (total revenue minus power pass-through). As seen, total revenue in the last two halves was very high due to elevated energy prices. I would have preferred if this had been highlighted in the FY23 presentation, where it contributed positively, rather than being buried in the annual report.
It is also proposed that “Net Revenue” be used to measure Short Term Incentives (STI) from FY25 onwards. There was no consideration for this change when it was benefiting the company, but now that the impact is different, a change seems necessary. While I do agree that net revenue is a more accurate reflection of business performance, I disagree with changing incentive measurements when it negatively affects outcomes and remaining silent when it benefits the company.
It frustrates me when management changes reporting metrics regardless. I have created a Net Revenue chart as well, which will be the focus going forward. The following two graphs show the historical trends for Total Revenue and Net Revenue
EBITDA and Unerlying EBITDA
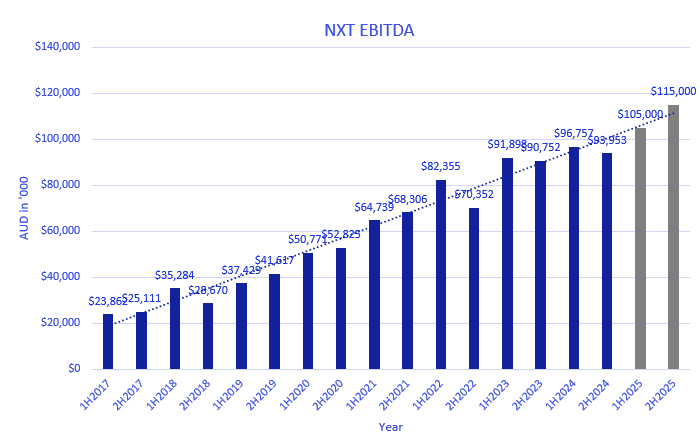
Both EBITDA and underlying EBITDA saw modest growth, but the costs associated with growth and maintaining existing data centers remain high. It’s challenging to distinguish which expenses are tied to NextDC’s expansion versus those needed to sustain operations. The case study at the end of their presentation suggests an EBITDA margin close to 90%, but corporate costs need to be factored in on top of that. I've included a chart below that shows the historical trends for both EBITDA and underlying EBITDA.
Net Cash inflow from Operating activities
I wrote following in my earlier post, when NextDC raised $1.3 billiion few months back
“I'm hoping that this will be the final time NextDC needs to ask for more money from investors. From now on, I'd like to see them use the money they make from their business to pay for any new projects they want to start”
The following chart shows the cash generated from operations (excluding lease payments and capitalized investments). Clearly, it isn’t sufficient to support the current growth plan. I was hoping that, with the existing liquidity, NextDC would reach a stage where it could start generating enough cash flow to fund growth from free cash flow. However, NextDC seems to be in a hurry, trying to get every dollar it can from wherever possible (either through dilution or debt) to expand
Future Outlook
Built capacity vs contracted utilisation
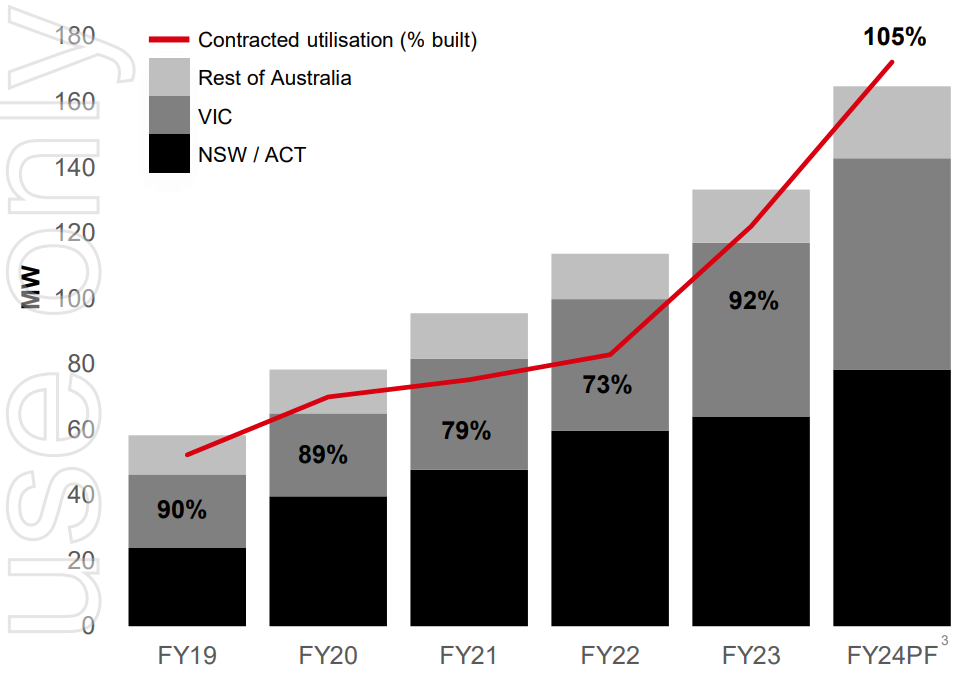
"Built capacity" refers to the power capacity fitted out at each facility.
"Contracted utilization" indicates customer commitments, which may have deferred start dates or ramp-up periods.
NextDC has already sold more capacity than it has built, suggesting future revenue growth once these contracts come into effect. The company has highlighted this in their FY24 presentation slides.
Contracted vs billing utilisation
While contracted utilization includes commitments with future ramp-up,
"billing utilization" represents the capacity for which revenue is being recognized. Currently, only about 50% of customer commitments are being billed as can be seen in the picture below ( taken from FY24 presentaiton slide). This means there's substantial upside potential once these existing contracts start contributing to revenue from FY26 to FY29
Forward order book
The forward order book, calculated as contracted utilization minus billing utilization, exceeds current billing utilization. This points to a strong pipeline of future revenue, though it depends heavily on successful execution.
FY25 guidance
NextDC has provided a range for its FY25 revenue and EBITDA guidance. I've modeled the top end of this range and split it into two halves for my projections. While the guidance does not suggest significant growth in FY25, there is potential for a substantial uptick from FY26 as contracted customers ramp up their billing.
Risks are growing
Increasing Number of Shares on Issue
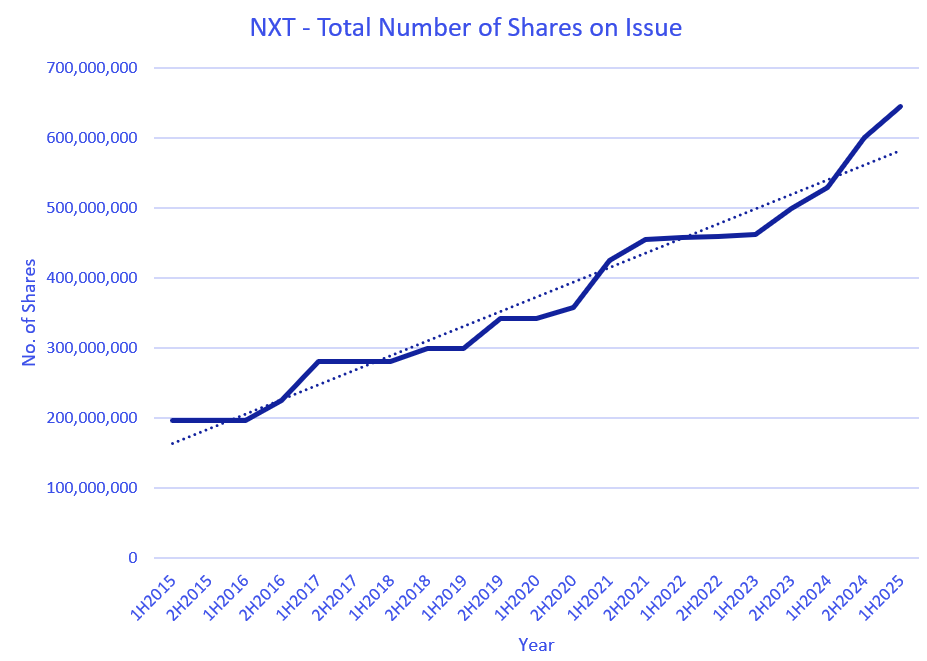
The recently announced $750 million capital raising, including a $200 million Share Purchase Plan (SPP), will lead to further dilution for existing shareholders. This, combined with existing debt, adds layers of financial risk.
Rising Borrowing
NextDC currently has $1.37 billion in debt and recently launched a further $2.9 billion syndicated loan facility, as reported by Bloomberg. This significant leverage raises concerns about the risk profile, especially as they expand into new markets in Asia, including Malaysia, Japan, New Zealand, and Thailand.
Increasing cost
NextDC is currently on a hiring spree to gear up for the expected doubling of its business over the next 3-4 years. Alongside this, the company is investing significantly in upgrading its systems and processes. This includes transitioning its CRM, facility management, and other platforms from a traditional capital expenditure model to an "as-a-service" model. While these changes are crucial for future growth, they also bring increased costs and higher risks.
Additionally, following a review toward the end of FY23, the Board approved a 15% increase in fixed remuneration for senior executives, including the CEO, effective from July 1, 2023. Another review in FY24 resulted in a further 10% increase in fixed remuneration for Key Management Personnel (KMP), including the CEO, effective July 1, 2024. The company also plans to raise the Short Term Incentive (STI) opportunity for KMP to up to 150% of fixed remuneration (from 100%) and increase the Long Term Incentive (LTI) opportunity for the CEO from 150% to 200% of fixed remuneration.
Final thoughts:
Looking ahead, it appears that FY25 will be a year of heavy investment for NextDC, with potentially limited immediate financial benefits. From my perspective, the company's bold expansion plans involve considerable execution risks, and any missteps could result in significant consequences. While there is a possibility that NextDC could achieve its ambitious objectives, it seems to me that the market is already pricing in a perfect outcome.
Personally, I would feel more at ease if NextDC were at a stage where it could generate enough free cash flow to fund its growth on its own. Currently, I perceive the balance between risk and reward as somewhat uneven, which has led me to adjust my portfolio weighting. I want to emphasize that this is simply my approach to managing risk, rather than any form of advice.
Although NextDC's strategy could very well be suitable given its market position and prevailing conditions, I think it's essential to recognize that it comes with significant risks that warrant careful consideration


I like the write up. At roughly 650 million SOI that gives a market cap of over $11 billion for ~$400 million revenue and ~$200 million underlying EBITDA, which would require a lot of growth to justify the current share price.